the network on which this host sits has been agressively identifying and blocking nimda hosts at the edge or at the nearest subnet device. no filtering of worm affected hosts was performed on this server. as such, the persistence seen in other studies (such as data recently published by arbor networks, see reference 1) is not observed here. this data gives us a measure of the effectiveness of these measures on a production network taking active measures to stem the tide.
this positioning of the host is important because of the 'island hopping' that code red 2 and nimda do, with the following characteristics: code red 2 will hit the hosts /8 with a 50% probability, a 37.5% chance it will scan in its /16, and a 12.5% chance it will scan a totally random network. for nimda this distribution is 50% in the same /16, 25% in the same /8, and 25% in a random network. see references 2, 3 and 4 for more information on these worms. hence, nimda and code red 2 hosts on the same network will be visible to this host (or any similarly positioned host) as it scans and attacks web servers. in contrast, the code red worm does not do any such island hopping, instead it moves from one randomly chosen network to another as it seeks victim hosts.
in the analysis of the data, it is important to recall that code red 1 and 2 each have one attack request, while nimda has seven unique attack requests. thus any one host infected by nimda would have seven times as many attacks logged per attack instance than a code red 1 or 2 attack.
data was culled from apache logs from approximately july, 1999, until may 18, 2002. this represents approximately 10 months of code red 1 traffic, over 9 months of code red 2 traffic, and approximately 8 months of nimda attacks. processing was done using shell scripts to extract requests matching the signature of the worm attack patterns. data was then sliced to show the number of unique hosts per day and the number of requests by worm type per day over this period. visualization was done using the gnuplot tool (see reference 5).

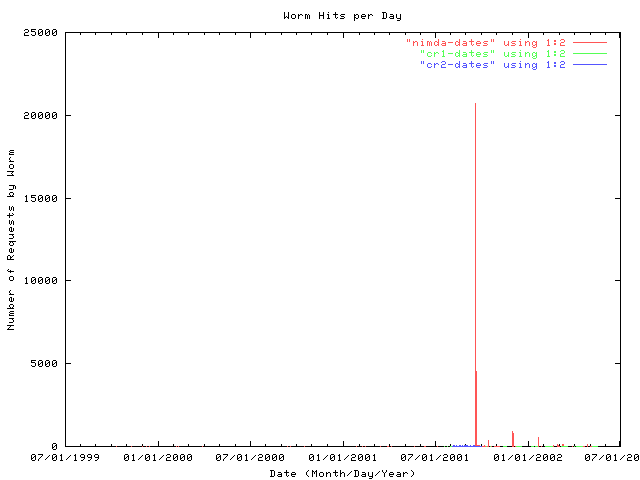
figure 1: total number of hits per day due to the worms nimda, code red 1 and code red 2. logfile signatures matching the worm requests made by code red 1 and 2 and nimda were extracted from an apache server's logs over a two year period. daily sums were taken and plotted. the sharp spike represents september 18, 2001, the global release date of the nimda worm. as is visible here, the scale of this dwarfs the visualization of the other data points on the graph.
in figure 2, the data is expanded on the y-axis, allowing for more a detailed understanding. immediately obvious is the aggressiveness of the nimda worm (represented in red bars), along with the swamping out of code red 2 (shown in blue bars). it is also interesting to note that code red 1 (represented in green) only shows mild amounts of penetration, however it does show a similar persistence to nimda, continuing at a noticable rate for more than 8 months. code red 2, in contrast, is almost entirely eliminated in the view of this single server within a 2 month period.
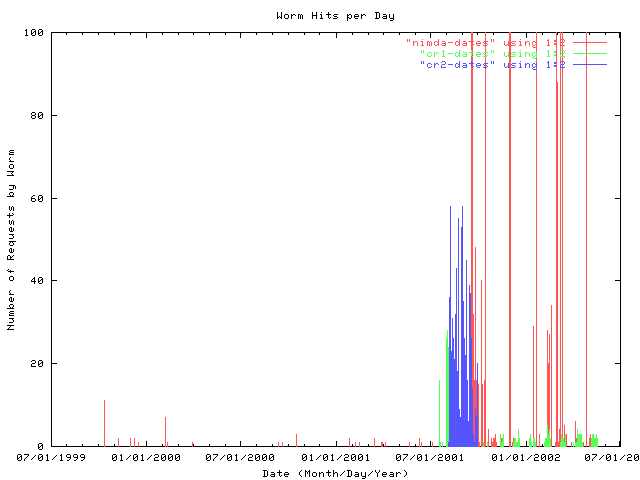
figure 2: an expanded view of the requests made by nimda, code red 2 and code red 1 in a two year period.. the data in this figure is the same as it is in figure 1, however the y-axis has been shrunk to make the data from code red 1 and 2 more visible. the result is that any detail for nimda is lost over this period.
the data in figure 2 preceeds the onset of these widespread worms by about one year. as such, we can gauge the amount of `noise' in the detection process. code red 1 and 2 each have a single attack which was uncommon for attackers to attempt manually. the exploit released by the eeye team, who discovered the vulnerability, used a different method and left a different signature in the server's logs. in contrast, nimda used seven different attack methods, some of which mirrored methods an attacker would try manually. as such, the `noise' in the nimda detection is noticably higher than the detection `noise' for code red 1 and 2. based on this, it is reasonable to say that the code red 1 persistence seen in figure 2 is not an artifact and represents a real phenomenon.
shown in figure 3 are the number of hosts detected for each type of attack per day. the immediate observation is that code red 1 took a bit to `ramp up' the number of hosts it was using for its attacks. the number of code red 1 hosts reaches a maximum a few days after the initial observation before it drops off dramatically. code red 2, in contrast, is an immediate onset with a pronounced persistence in the number of hosts seen. nimda shows this, as well, but noticably more dramatically. the first day the worm was seen shows a marked upsurge in infected hosts, almost 60, before dropping off quickly due to filtering.
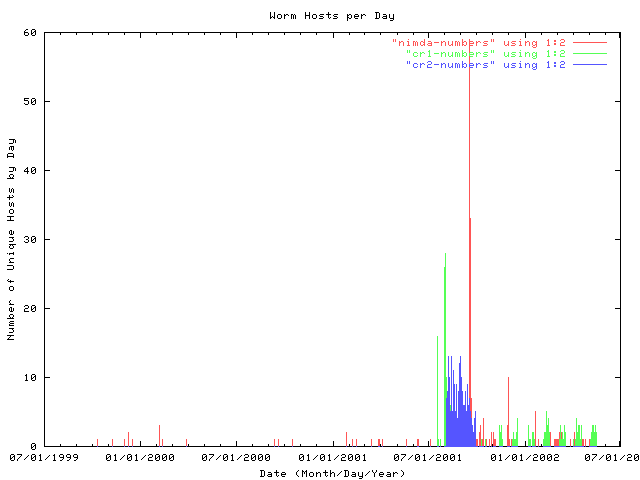
figure 3: the number of infected hosts seen per day. the server's logfiles were analyzed to determine the number of hosts seen per day and this value plotted as a function of time for each of the three worms analyzed in this report. these are not cumulatively unique, only the number of unique hosts seen per day.
analyzing the data in figure 3 further, we can assay the `noise' any one infection typically makes on the network. in the cases of code red 1 and code red 2, the number of hosts mirrors the number of attacks logged by the server. nimda hosts, however, do not show this mirroring. while there is a noticable spike in the number of nimda hosts seen on september 18, 2001, this number quickly drops off. the number of nimda requests seen, however, do not drop off as quickly. this suggests that the nimda worm is noticably more `noisy' than either code red 1 or code red 2, above its seven fold number of requests made during an attack compared to either of the variants of code red.
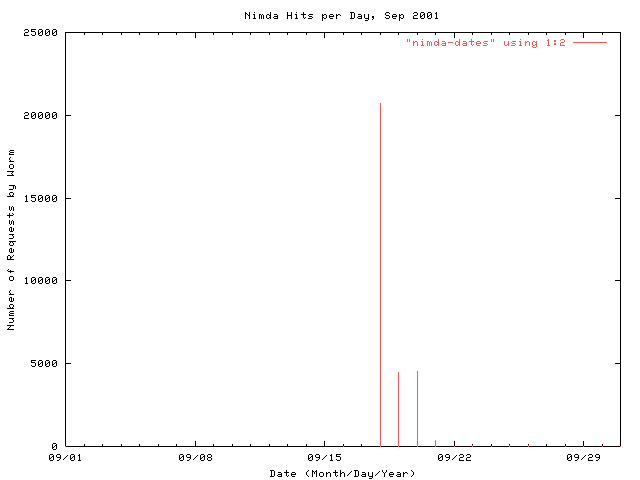
figure 4: the number of nimda requests seen in the month of september, 2001. the sudden onset of nimda on the monitored network on september 18, 2001, is clearly visible here. additionally, the active identification and blockage or removal of affected systems reduces this number to 1/12th of the first day's requests within 24 hours. on the 20th of september the worm shut down its active scanning and attacking of new nodes and instead began a DDoS against one of the IPs of www.whitehouse.gov.
the data in figure 5 can be used to assay the long term effectiveness of nimda mitigation techniques. the data from september, 2001, until january 1, 2002, has been plotted by the number of nimda hosts seen per day. after a very aggressive first round in september, nimda hosts only `flare up' a few times, typically at the beginning of the month. the most major flare up observed here is in december, 2001.
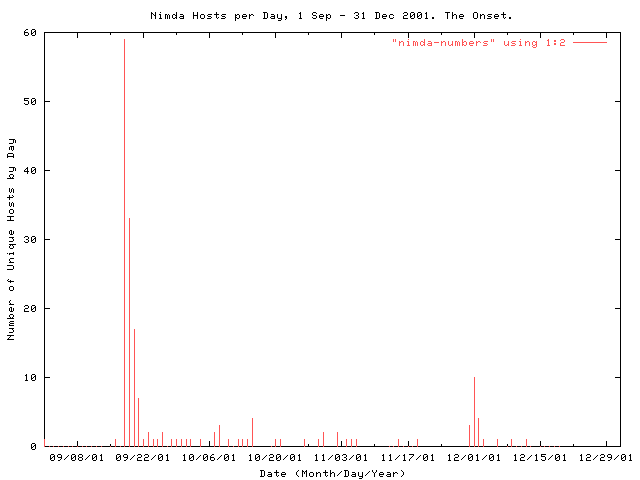
figure 5: the number of nimda infected hosts per day in the second half of the calendar year 2001. the number of nimda infected hosts were plotted per day for the second half of 2001 to ascertain the long term effectiveness of aggressive mitigation techniques. the bell shaped profile during the 1 december, 2001, flare up of nimda is most likely due to clock skew on various computers or the effect of differing timezones around the world.
from these two figures, 4 and 5, it is possible to say that the aggressive identification and filtering or removal of hosts affected by the nimda worm are effective. after an initial burst by the new worm, the number of attacks by nimda hosts decreases, a result of this strategy.